Notes
Patient Acquisition Cost: How to Calculate Yours, and Why Benchmarks Mislead
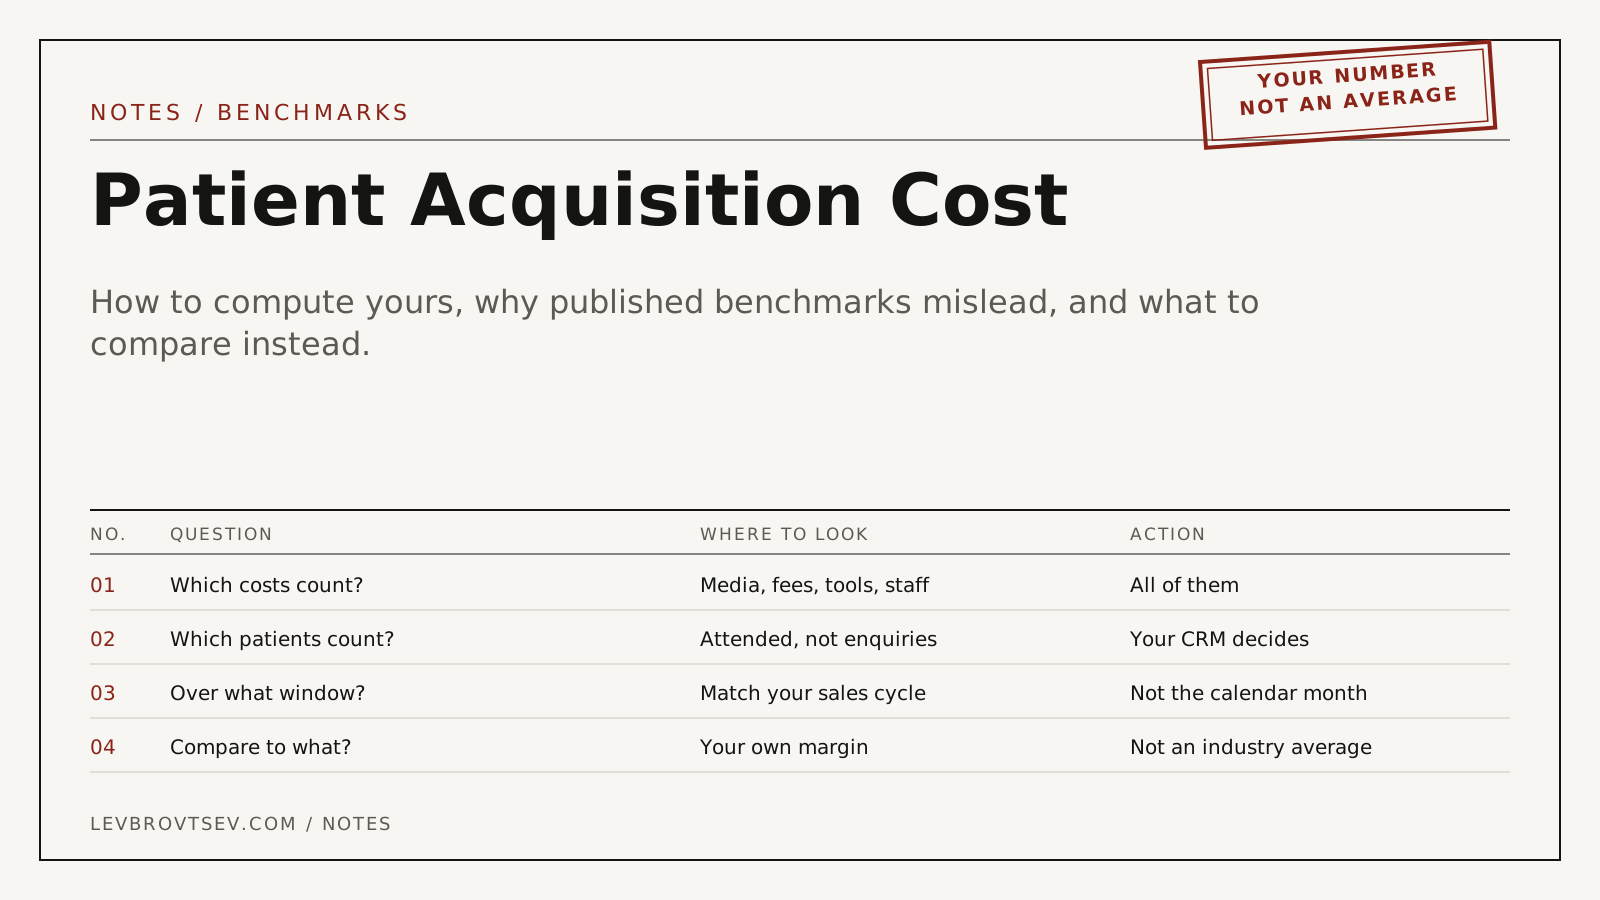
Patient acquisition cost is everything you spent to attract patients in a period, divided by the patients who actually attended. Everything means media, management fees, tools and the internal hours nobody counts. Attended means confirmed in your own system, not enquiries. Most published benchmarks omit at least three of those inputs, which is why they look reassuring.
Key takeaways
- Four cost inputs, one denominator. Leave any out and the number flatters you.
- The denominator is the argument: enquiries, bookings and attended patients give three different answers from the same spend.
- Compute it per procedure. A blended figure across implants and hygiene tells you nothing actionable.
- Match the window to your sales cycle. A calendar month hides anything that takes six weeks to decide.
- Compare against your own margin, not against an industry average from an article.
Contents
Someone sends you an article with a table: average patient acquisition cost by specialty. The number for your field looks lower than what you seem to be paying, and now there is a conversation about whether marketing is working.
That table is almost certainly counting different things than you are.
What is patient acquisition cost?
Patient acquisition cost is the total cost of acquiring new patients in a period divided by the number of new patients acquired. In healthcare the two words doing the work are "total" and "acquired": whether you include fees, tools and staff time, and whether a patient means an enquiry, a booking or someone who sat in the chair.
What goes into the number
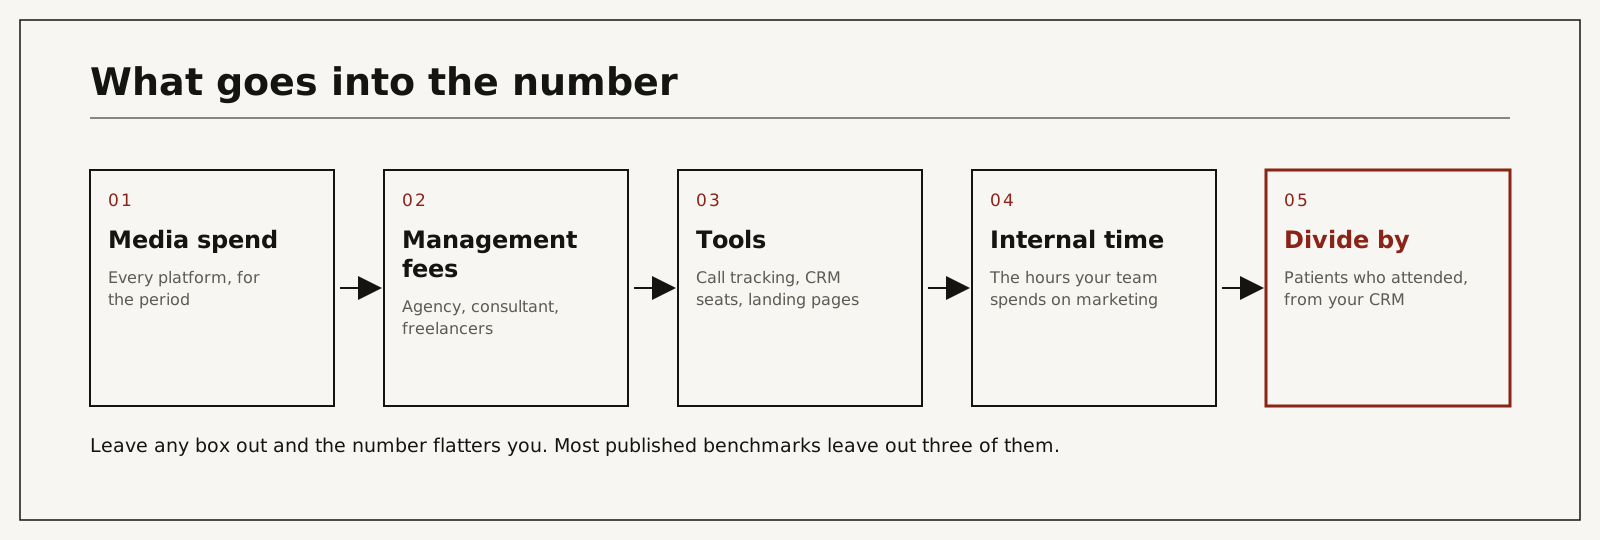
| Input | Include | Common mistake |
|---|---|---|
| Media spend | Every platform, for the period | Counting Google only |
| Management fees | Agency, consultant, freelancers | Treated as overhead |
| Tools | Call tracking, landing pages, CRM seats used by marketing | Never counted |
| Internal time | Hours your team spends on marketing at a loaded rate | Considered free |
| Denominator | Patients who attended, from your CRM | Using enquiries |
The internal-time line is the one that causes arguments. Include it if you want a real number for decision-making; exclude it if you only compare against your own history. Do not switch between the two.
The denominator decides the answer
Take one month and one budget, and ask the same question three ways.
If sixty enquiries came in, cost per enquiry is the friendliest number and the one most reports show. If twenty of those booked, cost per booking is three times higher. If fourteen attended, cost per attended patient is more than four times the first figure. Nothing about the spend changed.
This is why the denominator has to be written down before anyone quotes a target. It is also why the number cannot be produced without a system that follows an enquiry to an appointment, which is the whole purpose of the click-ID loop described in the offline conversion tracking guide and the identifier in what a GCLID is.
Why two clinics get different numbers
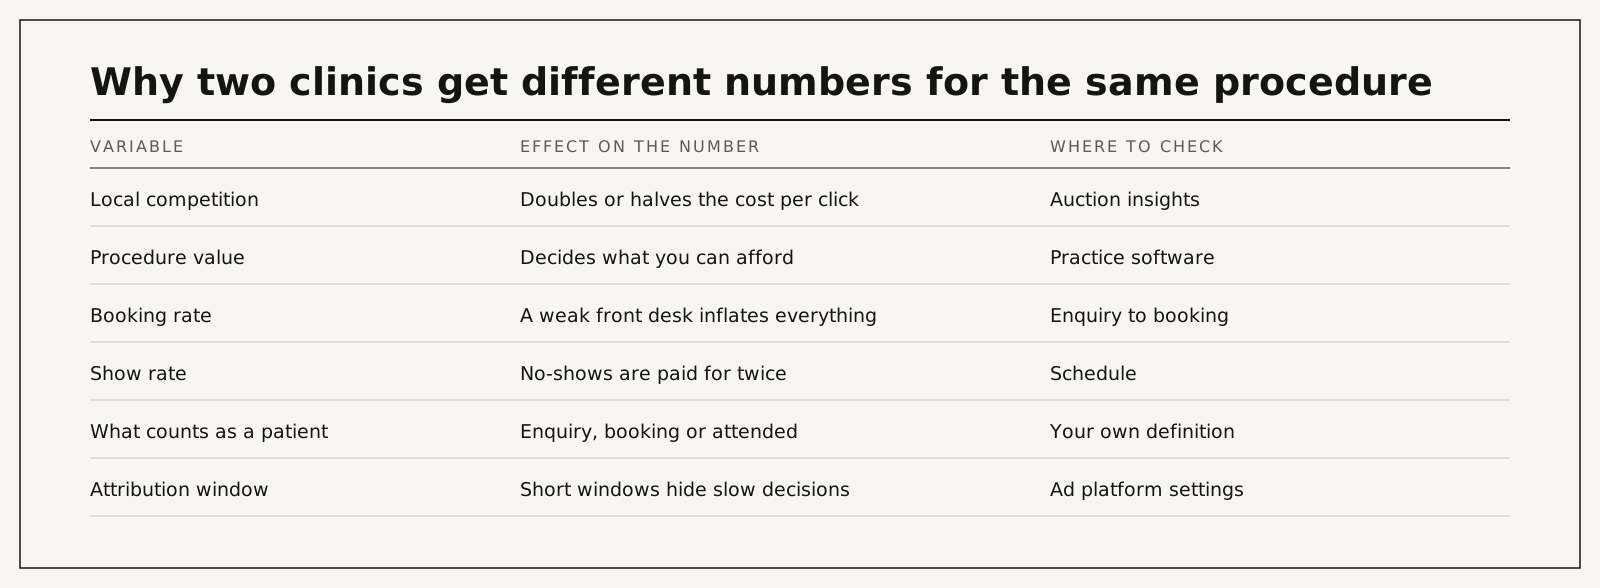
| Cause | What actually happens | Hidden cost | What you see | Risk level |
|---|---|---|---|---|
| Local competition | Cost per click varies several times over between markets | A national average is meaningless locally | Auction insights full of names | High |
| Procedure value | Decides what you can afford, not what you pay | Wrong target applied to the wrong service | One blended CPA goal | High |
| Booking rate | A weak front desk inflates the final number | Paying twice for the same demand | Enquiries far above bookings | High |
| Show rate | No-shows consume acquisition spend | Clinician time lost as well | Gaps in a full schedule | Medium |
| Definition of a patient | Enquiry, booking or attended | Three different verdicts on the same month | Nobody wrote it down | High |
| Attribution window | Short windows discard slow decisions | Long-cycle procedures look unprofitable | 30-day window on a 60-day cycle | Medium |
What you can afford, rather than what others pay
The useful comparison is internal. Take the production value of a case, take the gross margin on it, decide what share of that margin you will spend to acquire one, and you have a ceiling. Then measure against the ceiling, monthly.
A full-arch case with several thousand dollars of margin can carry a meaningful acquisition cost and still be excellent business. A routine hygiene visit cannot carry any paid acquisition at all, and the answer there is reviews, recall and the Business Profile rather than a budget. The framework for setting that ceiling is in healthcare marketing strategy.
I am deliberately not publishing a table of averages by specialty. I do not have a dataset I would stand behind, and the tables that circulate are compiled from vendor blogs rather than from measured accounts. A number you cannot trace to a method is worse than no number.
How to compute yours this week
- Pick one procedure and one three-month window that covers your decision cycle.
- Add media spend, fees and tools for that window. Add internal hours if you want the full figure.
- From your CRM or practice software, count patients for that procedure who attended, and whose first contact falls inside the window.
- Divide. Write down which denominator you used.
- Repeat for your second and third procedures. Do not blend them.
- Put the result next to the margin on that case.
If step three is impossible, that is the finding, and the project is measurement before marketing.
What it costs to fix a bad number
Market figures were checked in September 2026 for the US and Canada. They are ranges, not quotes.
| Route | Typical cost | Time to a trustworthy number | What it depends on |
|---|---|---|---|
| Count manually for one quarter | Staff hours | Weeks | Someone recording the source at enquiry |
| Developer connects the CRM | A few hours for capture, more with booking tools and call tracking. Upwork lists tag manager specialists at $20 to $49 an hour, median $30; senior US consultants at $85 to $175 | Days to weeks | CRM API, number of entry points |
| Agency adds it | Often inside a retainer of 10% to 20% of spend | Their queue | Whether they have CRM access |
| I build it | Audit at $500 per ad account, credited toward the first month; the build is a fixed quote from the audit | Scoped in the audit | Entry points, CRM, sign-off |
| Keep using cost per lead | Nothing today | Never | Budget follows the cheapest enquiries |
The audit covers your ad account, the tracking and the path from enquiry to booked patient, and ends with a 90-day plan. It is credited toward the first month if you continue with me.
You work with me directly. There are no account managers and no juniors.
Compute it per procedure, then decide
Pick your highest-value procedure, add every cost, divide by patients who attended, and put that next to the margin. The decision about budget becomes obvious in about an hour, and stays obvious for the rest of the year. If you would like the number produced from your own account and CRM, start with the audit, or see how the measurement works under CRM-verified attribution.
Frequently asked questions
What is a good patient acquisition cost?
One comfortably below the gross margin on the case it produces, by a share you decided in advance. There is no universal figure, and any specialty average you read was calculated with inputs you cannot see.
Should patient acquisition cost include staff time?
Include it for decision-making, exclude it for tracking your own trend, and never switch between the two mid-year without saying so.
Is patient acquisition cost the same as cost per lead?
No, and the gap between them is usually three to five times. Cost per lead counts enquiries; acquisition cost counts patients. The argument is in cost per patient versus cost per lead.
How do I measure it for procedures with long decision cycles?
Use a window that covers the cycle and attribute by first contact date, not by the month the patient attended. Google accepts a click for up to 90 days, which sets a practical ceiling on platform-side reporting.
Why is my number higher than the benchmarks?
Usually because you counted fees, tools and attended patients while the benchmark counted media spend and enquiries. Compare your number to itself over time instead.
How often should we recalculate it?
Monthly for the trend, quarterly for decisions. Anything more frequent is noise in most practices.
Who does the work if I hire you?
I do: the tracking, the CRM connection and the reporting. Nothing is subcontracted or delegated.
How do I verify the number is honest?
Three checks: the denominator is written down, the same definition was used last month, and the total spend line includes fees and tools. If all three hold, the trend is trustworthy even if the absolute figure is debatable.