Notes
Google Ads Benchmarks for Healthcare: Why the Tables Mislead
Published healthcare benchmarks for cost per click, conversion rate and cost per lead are averages of accounts with different definitions, in different cities, at different times of year. They are useful for one thing: noticing that your number is an order of magnitude away from everyone else's. For every decision after that, your own four-week baseline is worth more than any table.
Key takeaways
- Most benchmark tables do not state what counts as a conversion, which makes the cost per lead figure meaningless.
- Local competition moves cost per click more than any other variable, and it is invisible in a national average.
- Seasonality in aesthetics and dental is large enough to explain most month-on-month "problems".
- Build your own baseline in four weeks. Then compare only against yourself.
- If you must compare externally, compare cost per click, never cost per lead.
Contents
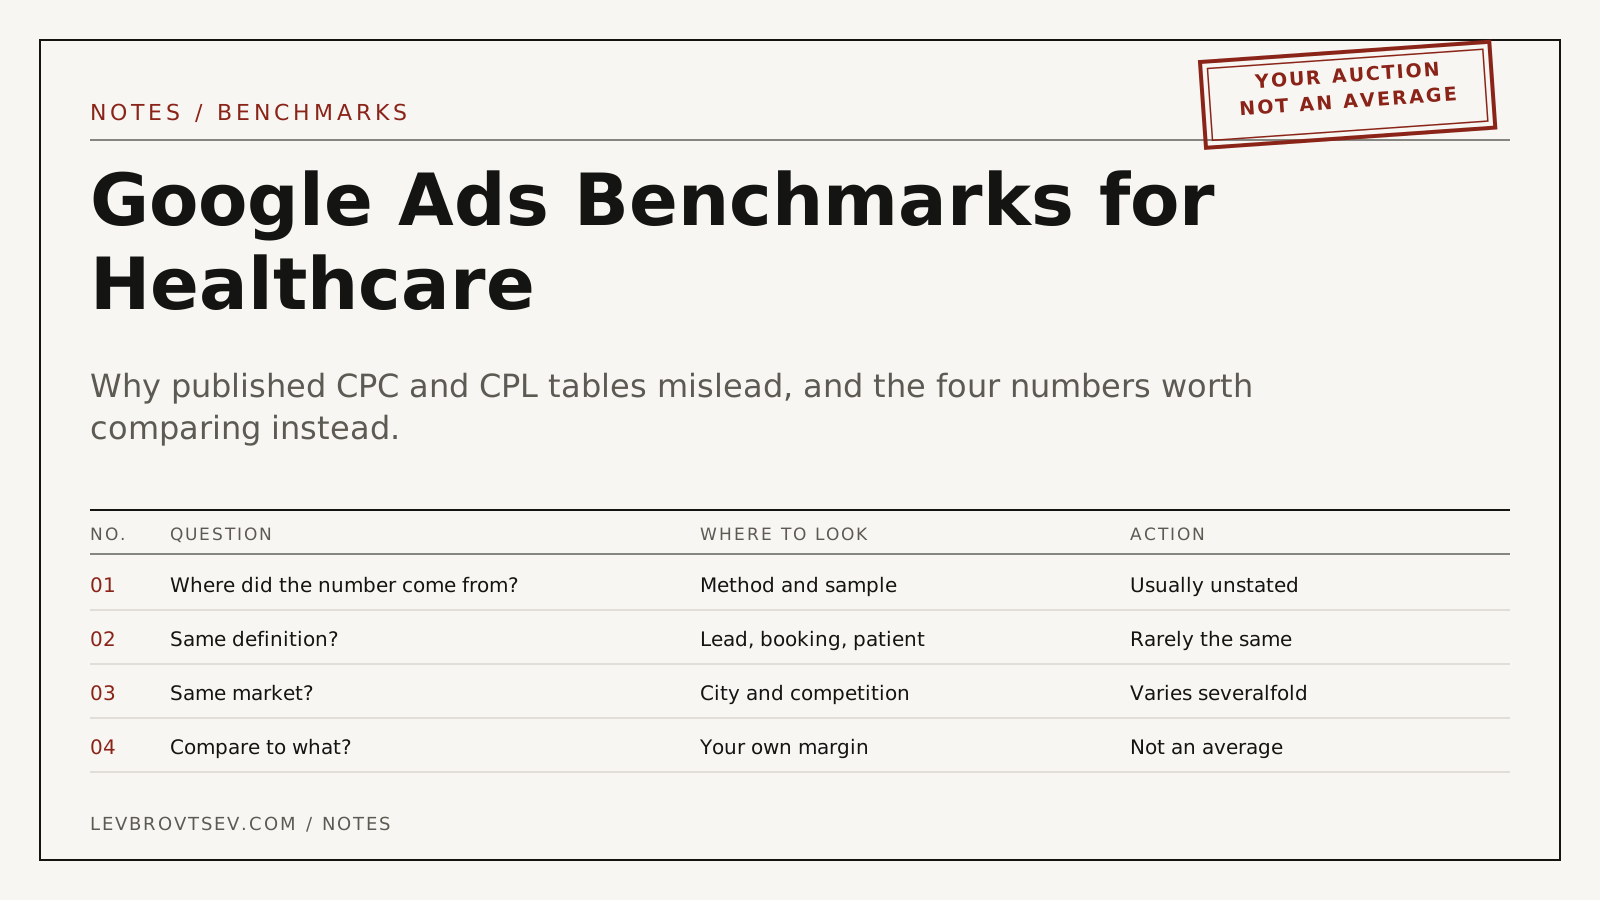
Someone sends a table: average cost per lead in healthcare, by specialty. Yours is higher. Now there is a meeting about whether the ads are working.
Before that meeting, ask one question: what did that table count as a lead?
Should you use healthcare benchmarks at all?
Use them as a smell test, not as a target. If your cost per click is three times the published range for your specialty, something specific is worth investigating: match types, quality, geography. If it is thirty percent higher, that is noise, and the published figure was probably calculated from a different definition anyway.
I am not publishing a table of averages here. I do not have a dataset with a method I would stand behind, and the tables in circulation are compiled from vendor blogs rather than measured accounts. A number without a method is worse than no number.
Why two clinics see different numbers
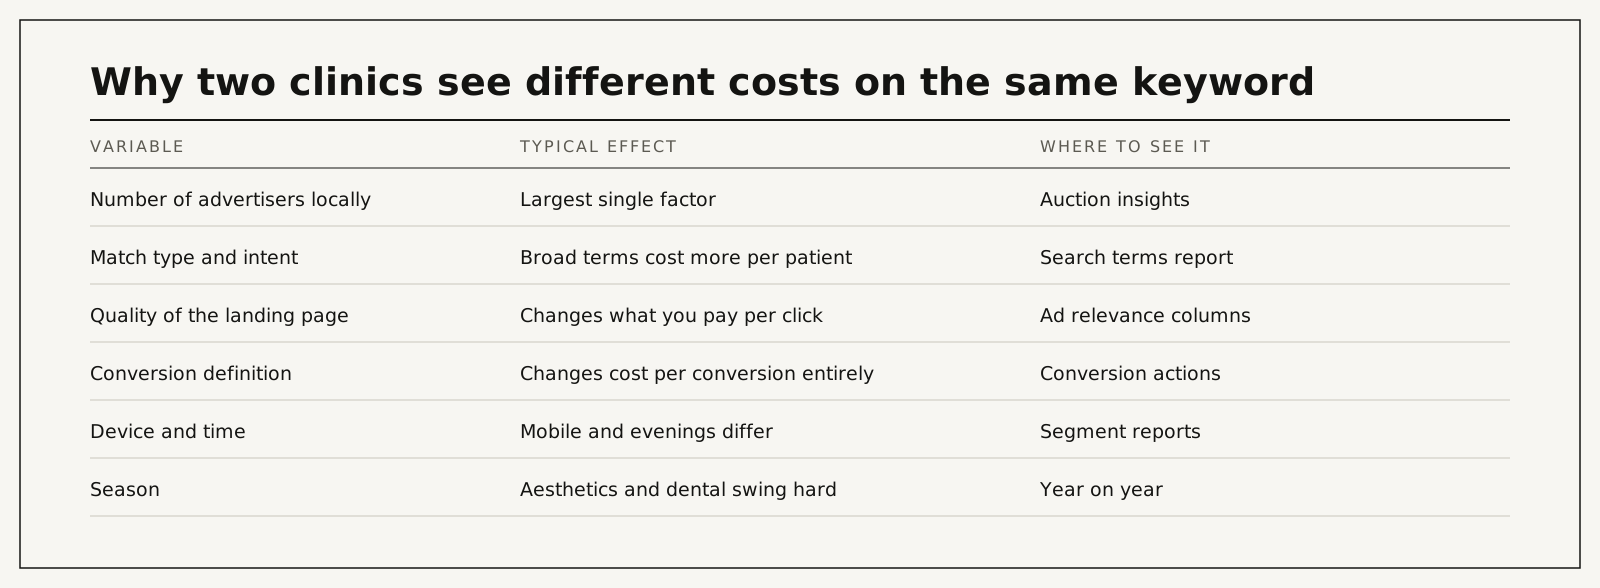
| Cause | What actually happens | Hidden cost | Where to see it | Risk level |
|---|---|---|---|---|
| Number of local advertisers | The largest single factor in cost per click | A national average tells you nothing locally | Auction insights | High |
| Match type and intent | Broad terms convert worse and cost more per patient | Blended numbers hide it | Search terms report | High |
| Landing page quality | Changes what you pay per click for the same position | Slow, invisible tax | Ad relevance and landing page columns | Medium |
| Conversion definition | Changes cost per conversion entirely | Two accounts are not comparable | Conversion actions list | High |
| Device and time of day | Mobile and evening traffic behave differently | Averages hide both | Segment reports | Medium |
| Season | Aesthetics and dental swing hard across the year | Panic in a slow month | Year-on-year comparison | Medium |
The fourth row is the one that invalidates most comparisons. If your account counts attended patients and the benchmark counted form fills, your cost per conversion should be several times higher, and that is a sign of better measurement rather than worse performance. The argument is in cost per patient versus cost per lead.
What is worth comparing externally
Cost per click, roughly, for the same procedure in a comparable market. It is the most standardised number in the auction and the least dependent on how you define success.
Everything else, conversion rate, cost per lead, cost per acquisition, depends on your forms, your definitions and your front desk. Comparing those between accounts is comparing three unrelated things at once.
Build your own benchmark in four weeks
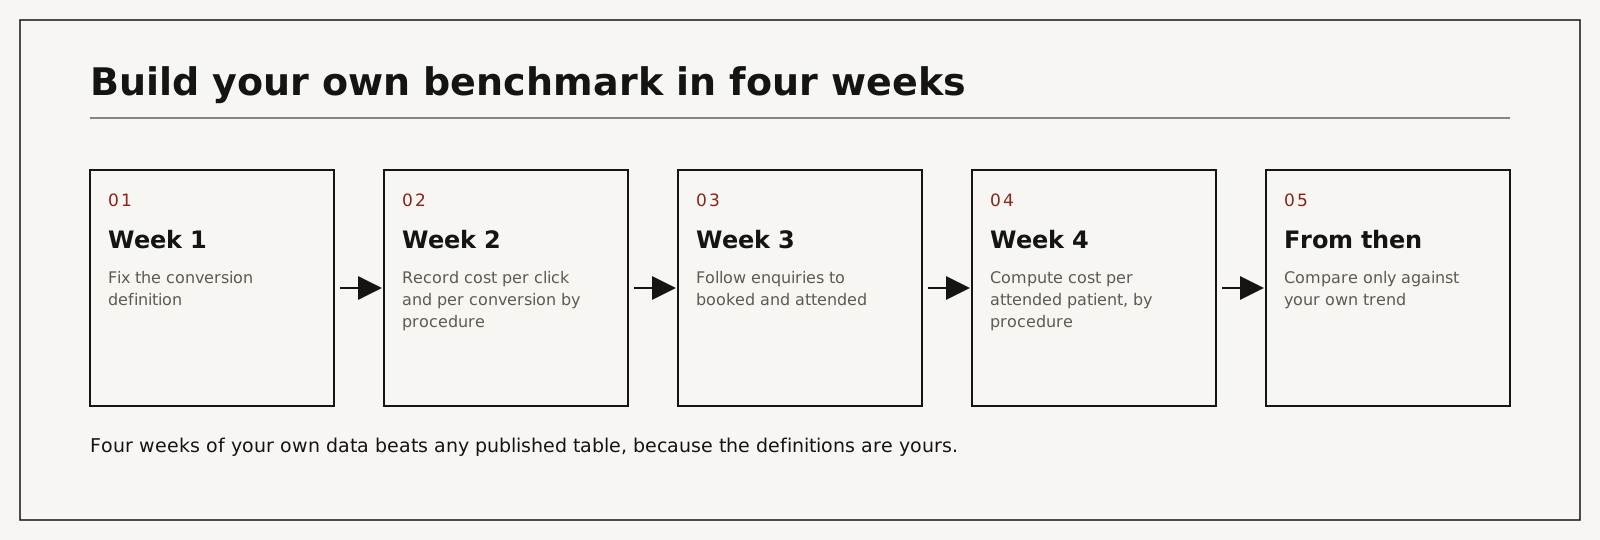
Week one: fix the conversion definition. One primary action that means something, everything else secondary. The method is in the conversion tracking guide.
Week two: record cost per click and cost per conversion by procedure, not blended.
Week three: follow those enquiries to booked and attended, in your own system.
Week four: compute cost per attended patient by procedure, and write down the definitions you used.
From then on, compare against your own trend. A number you can trace beats a number you cannot, every time.
What goes wrong when benchmarks drive decisions
| Cause | What actually happens | Hidden cost | What you see | Risk level |
|---|---|---|---|---|
| Target set from a published CPL | The target is based on someone else's definition | Campaigns paused that were working | A CPA goal nobody can justify | High |
| Blended targets across procedures | High-value work looks expensive | Budget drifts to cheap services | One goal for the whole account | High |
| Month-on-month comparison in a seasonal field | Normal variation read as failure | Strategy changed for no reason | A bad August in aesthetics | Medium |
| Judging a new account in week two | Learning period mistaken for results | Accounts restarted repeatedly | Frequent structural changes | Medium |
| Benchmarks from another country | Different auction, different costs | Wrong expectations entirely | US figures used for a Canadian account | Medium |
What it costs to get real numbers
| Route | Typical cost | Time to a trustworthy baseline | What it depends on |
|---|---|---|---|
| Do it yourself with this method | Staff hours over four weeks | Four weeks | Access to the account and the CRM |
| Agency produces it | Usually inside a retainer of 10% to 20% of spend | Their queue | Whether they will report on patients |
| I produce it | Audit at $500 per ad account with a 90-day plan, credited toward the first month | Scoped in the audit | Tracking state, CRM access |
| Keep using published tables | Nothing | Never | Decisions made on other people's definitions |
The audit covers your ad account, the tracking and the path from enquiry to booked patient, and ends with a 90-day plan. It is credited toward the first month if you continue with me.
You work with me directly. There are no account managers and no juniors.
Compare yourself to last quarter
Take one procedure, fix what counts as a conversion, and run four clean weeks. The resulting number will be less flattering than the table someone sent you and far more useful, because you will know exactly what is inside it. If you would like the baseline built from your own account, start with the audit, or see how I run Google Ads for healthcare.
Frequently asked questions
What is a good cost per click in healthcare?
It depends on the procedure and the market, and varies severalfold between cities for the same keyword. Check auction insights for who you are bidding against before deciding your number is wrong.
What is a good conversion rate for a medical practice?
Unanswerable without knowing what counts as a conversion. A page counting phone-number taps will report several times the rate of one counting completed consultation requests.
Why is my cost per lead higher than the benchmark?
Often because you count something more meaningful than the benchmark did. Check the definitions before treating it as a performance problem.
Are healthcare clicks really more expensive?
Regulated, high-value categories tend to be competitive, yes. But "healthcare" spans hygiene appointments and full-arch implants, and those do not share an auction.
How long before my own numbers are reliable?
Four weeks for platform metrics with a fixed definition, one to three months for cost per attended patient in a field with a long decision cycle.
Should I compare against my competitors' spend?
Auction insights shows overlap and impression share, not spend. Use it to understand pressure on the auction, not to set targets.
Who does the work if I hire you?
I do: the definitions, the measurement and the reporting. Nothing is subcontracted or delegated.
How do I know my baseline is honest?
Write the definitions next to the numbers. If someone else could reproduce your figure from the same account, it is a benchmark. If not, it is an impression.